
Marketo
Case Study
Multi-Store Business Intelligence Dashboard
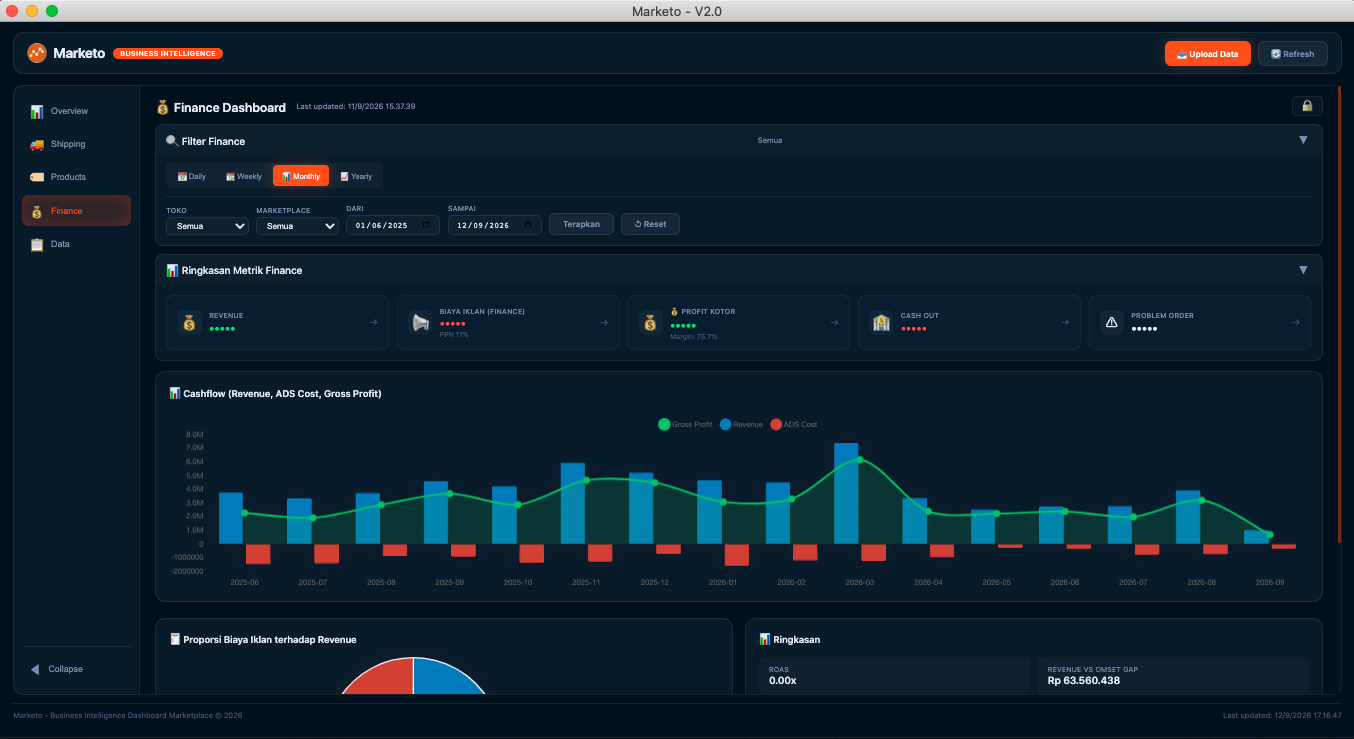
Marketo Demo
1 / 6
Overview
Marketo is an offline-first desktop business intelligence dashboard for marketplace sellers. It aggregates data from multiple stores — orders, ads, and transactions — into a unified view with real-time analytics.
The tool eliminates manual Excel work: upload raw files, get instant metrics, charts, and financial reports. Built with a raw-first architecture and modular system.
Problem
- Scattered Data SourcesOrders, ads, and transactions live in separate files with different formats. Combining them manually is time-consuming and error-prone.
- Manual Processing OverheadSellers spend hours every week copying, pasting, and pivoting Excel data — instead of using that time to grow their business.
- No Trend AnalysisWithout historical trend data, sellers can't see what's working — or what's not. Decisions are made on gut feeling, not numbers.
- Disconnected DataOrder data, ad spend, and transaction records are not linked. There is no unified view of true profit, cashflow, or ROI.
- Multi-Store Comparison is HardOwners with multiple stores struggle to compare performance. Each store has its own file, its own format, and its own report — making side-by-side analysis nearly impossible.
Solution — Raw-First Architecture
Raw Store
Simpan semua kolom asli — audit trail, re-process
Adapter
Transform per tipe data — modular, multi-marketplace
Master Files
Data terstruktur — single source of truth
Dashboard
Render UI — modular per fitur
My Role
As Technical Project Lead & AI Orchestrator, I led the entire project from ideation to deployment:
- Defined system architecture and raw-first data model
- Built the modular system with module loader
- Designed 5 modules: Overview, Finance, Shipping, Products, Data
- Implemented adapter pattern for multi-marketplace
- Documented every phase with 12 development logs + modular blueprint
Key Features
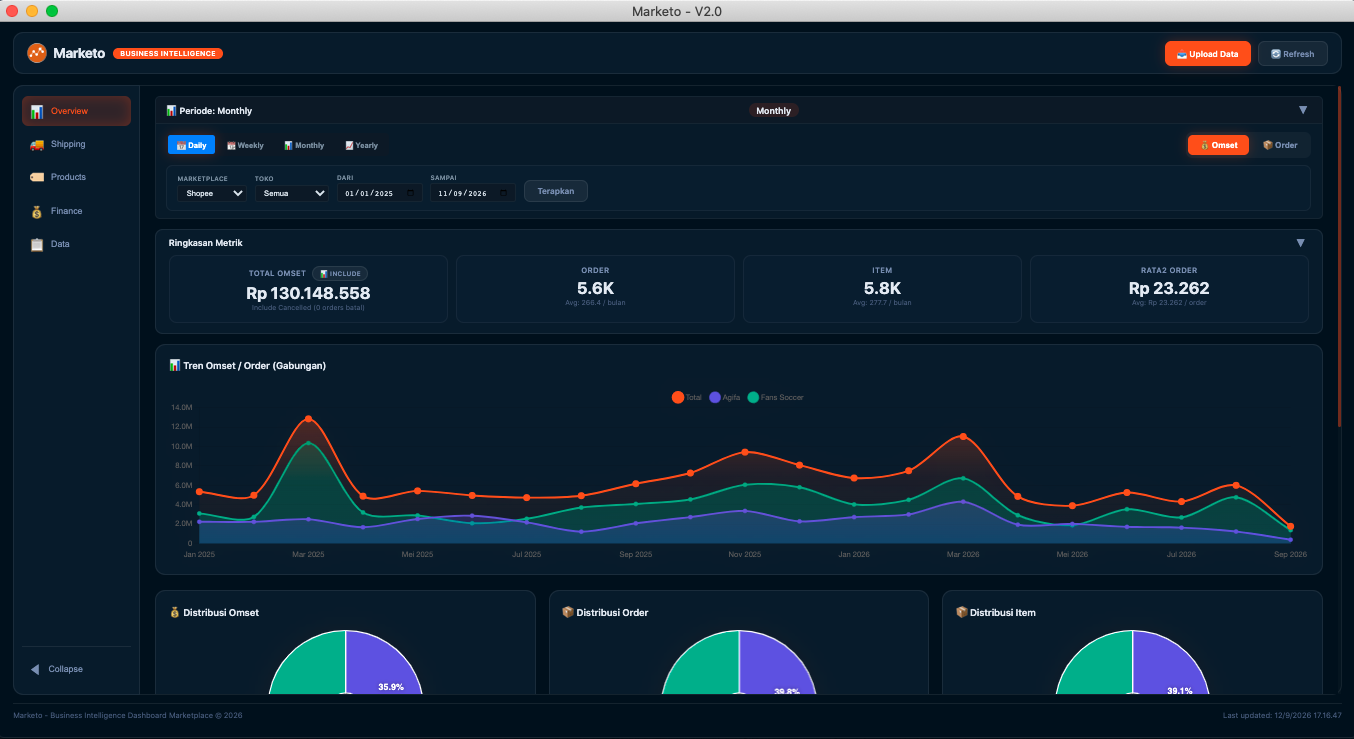
Overview — Order Analytics
Status cards, 4 key metrics, combined chart, 3 pie charts, top products, data table, and auto default date range.
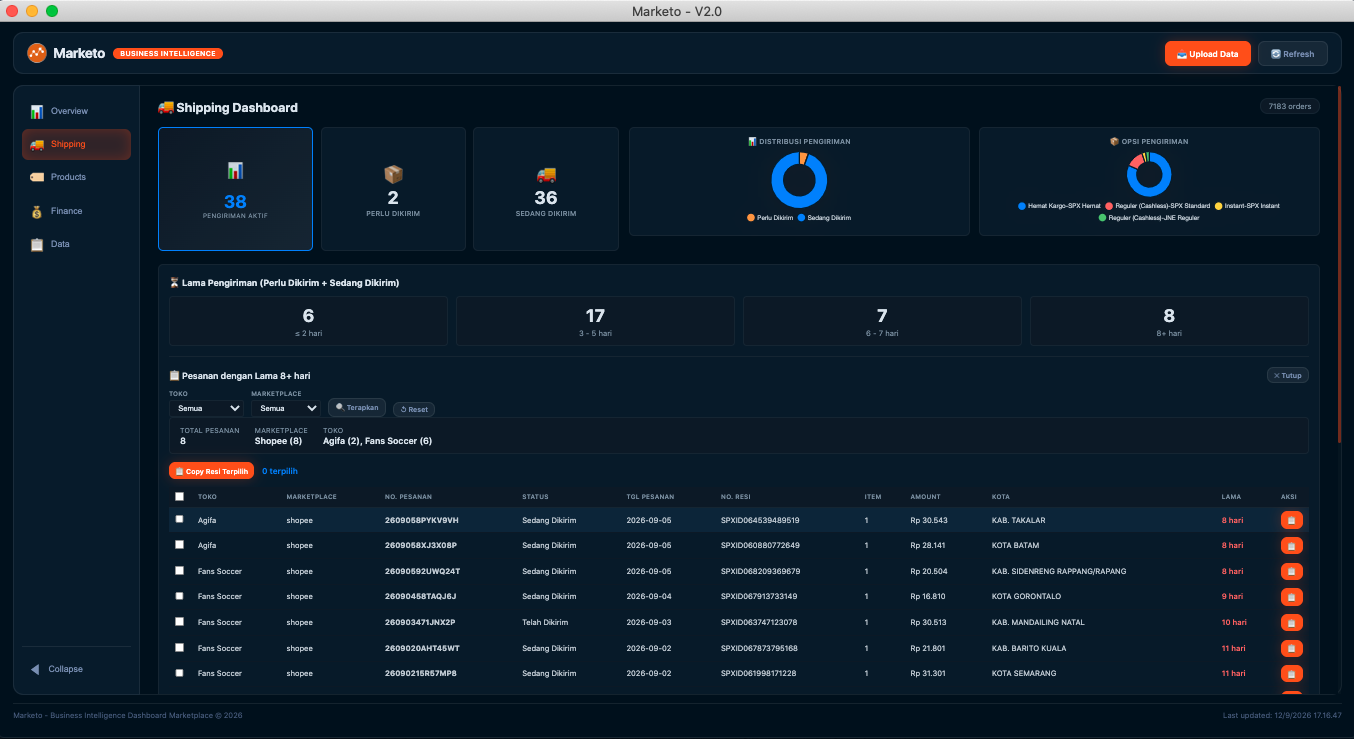
Shipping — Aging & Tracking
Hero cards, 4-tier aging categories, copy tracking numbers (single + bulk), and CSV export.
Finance — Revenue & Profit
5 header cards, Revenue vs Omset comparison, Cashflow chart, detail pages, and dynamic PPN (Finance View + Business View).
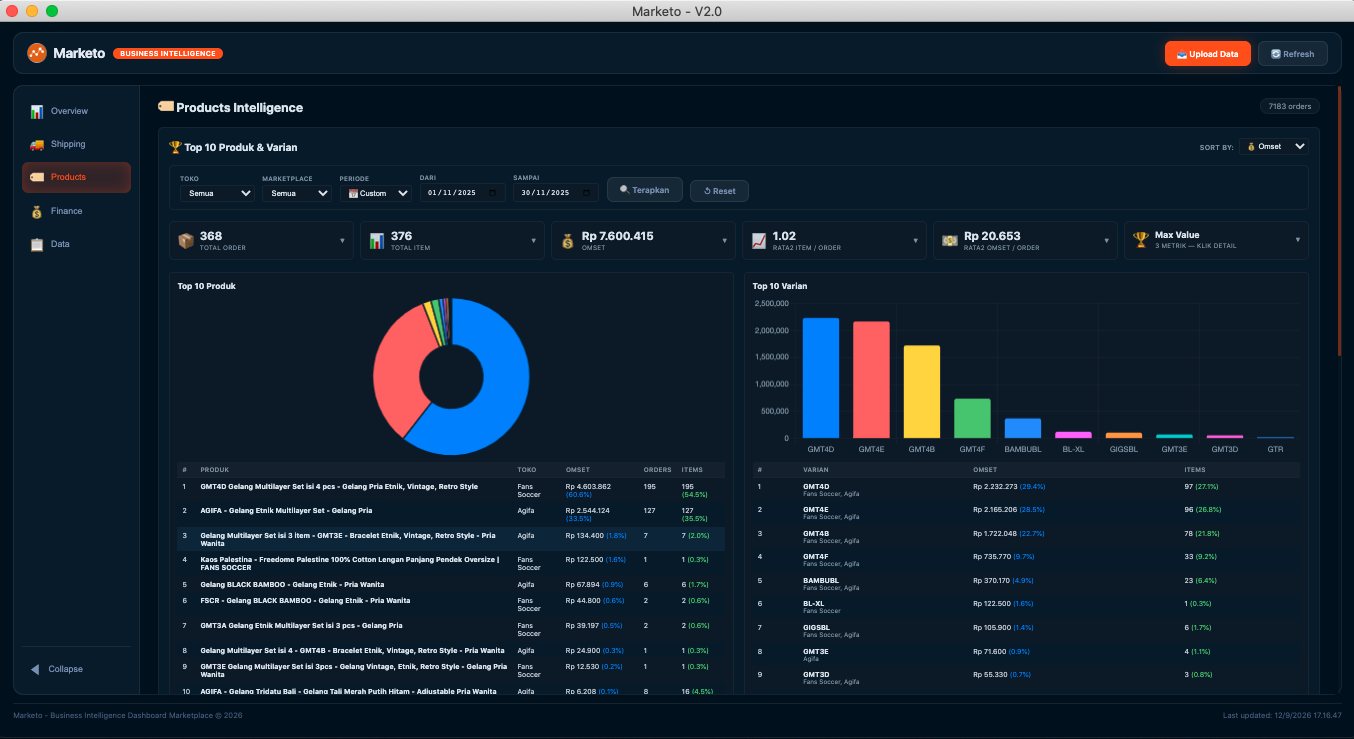
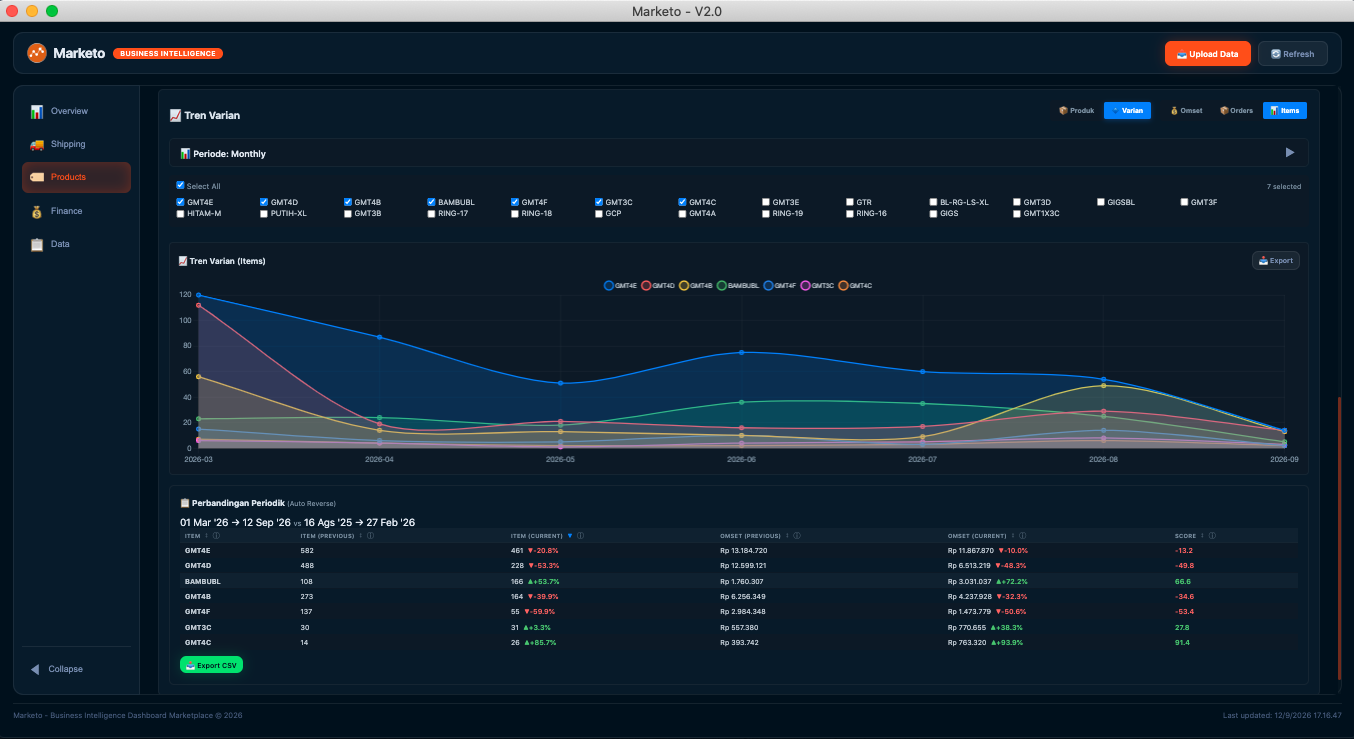
Products — Top 10 & Trend
Top 10 products & variants, trend line chart, Score Formula, cross-store variant analysis, and CSV export.
Data — Master & Settings
Master data table, batch history (3 sources), PPN settings, and finance preview.
Architecture Highlights
Raw-First Architecture
All raw data is stored before transformation — enabling audit trails, re-processing, and rollback at any time.
Adapter Pattern
Each marketplace has its own adapter — making the system easy to extend to new platforms.
Dynamic Module Loader
Modules are loaded dynamically from a manifest — keeping the system scalable and maintainable.
Auto Default Date Range
A small UX detail: the filter automatically defaults to the current month, saving time on every visit.
Dynamic PPN
Finance View vs Business View — because ad spend means different things to different teams.
Score Formula
(Item % × 0.3) + (Revenue % × 0.7) — measuring relative contribution, not just absolute numbers.
Project Structure
Modular architecture — separation of concerns, scalable, maintainable. Click to expand.
Tech Stack
Data Scale
| File | Size | Records |
|---|---|---|
| master_orders.json | 31 MB | 8.540 |
| master_ads.json | 1.4 MB | ~1.787 |
| master_transactions.json | 9.5 MB | ~9.000 |
| raw_orders.json | 23 MB | - |
| raw_ads.json | 988 KB | - |
| raw_transactions.json | 5.8 MB | - |
Total: ~64 MB data, ~19.000+ records
Outcome
- 18 development phases completed — from initial setup (Phase 0) to final polishing (Phase 18.6).
- 5 active modules delivered: Overview, Shipping, Finance, Products, and Data.
- ~19,000+ real records processed and stored — from orders, ads, and transactions.
- 12 development logs + a modular blueprint — documenting every decision and iteration.
- Production-ready MVP — stable, tested, and ready for daily use.
Lessons Learned
Raw-First Architecture Pays Off
Storing raw data before transformation made re-processing, auditing, and rollback possible — without ever losing the original source.
Modularity Enables Scale
Independent modules made it easy to extend, debug, and maintain — even as the system grew to 5 modules and 19,000+ records.
Iteration Beats Perfection
Phases 0 to 18.6 followed a simple principle: ship the core first, then polish. Progress over perfection.
Known Issues Are Not Blockers
5 known issues and 7 technical debts were documented, prioritized, and deferred — not ignored. They became the roadmap, not the blocker.
Documentation is Knowledge Preservation
12 development logs and a modular blueprint turned scattered decisions into a living knowledge base — accessible anytime, by anyone.